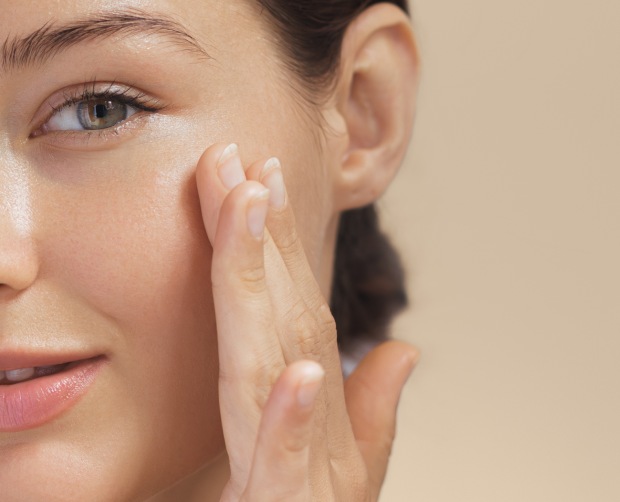


Altrient Liposomal Vitamin C and its Impact on Skin Firmness
Independent clinical research by Princeton Consumer Research, 2014, ABUCUT1
All results statistically significant at p < 0.05. Active groups showed significant improvement at every time point. Placebo group showed no statistically significant change at any time point.
SKIN ELASTICITY AT 16 WEEKS
SKIN ELASTICITY AT 12 WEEKS
FINE LINES AT 16 WEEKS
OF ACTIVE PARTICIPANTS IMPROVED

Study Overview
This is the most rigorous independent clinical trial of Altrient C conducted to date. A double-blind, randomised, placebo-controlled design — the highest standard in clinical research — was used to evaluate whether different doses of Altrient C produce measurable, objective improvements in skin firmness, elasticity and the appearance of fine lines and wrinkles.
The double-blind design is particularly important: neither participants nor study staff knew who was receiving active product until after the data had been collected and analysed. This eliminates both placebo effect and observer bias from the results, making the findings as reliable as consumer product clinical evidence gets.
Study Details
Study centre: Princeton Consumer Research Ltd, Maldon, Essex, UK
Dates: 4th August 2014 – 28th November 2014
Duration: 16 weeks with assessments at weeks 0, 4, 8, 12 and 16
Design: Double-blind, randomised, placebo-controlled
Participants recruited: 45 | Completed: 41
Withdrawals: 4 (all for reasons unrelated to the product)
Adverse events: Zero
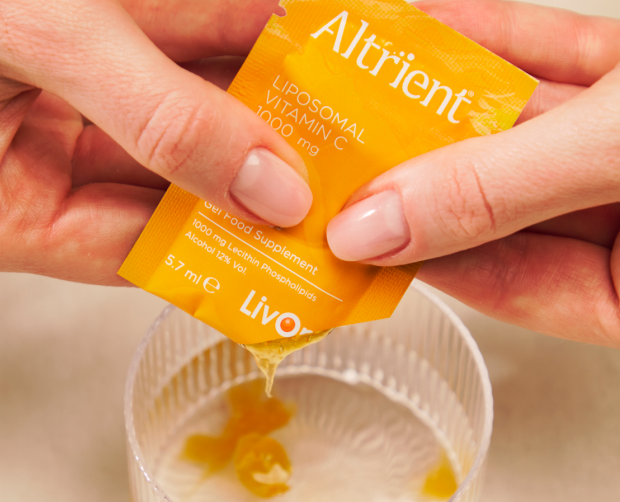
Three groups — all taking 3 sachets/day
Group A: 1 active + 2 placebo sachets/day (1,000mg liposomal vitamin C)
Group B: 3 placebo sachets/day (0mg — control group)
Group C: 3 active sachets/day (3,000mg liposomal vitamin C)
Because all participants took 3 sachets per day, no one could tell from the routine which group they were in — a critical feature of the blinding protocol.

How Skin Was Measured
Two complementary, non-invasive measurement techniques were used at each assessment point, capturing different but related aspects of skin ageing. Both are established instruments in peer-reviewed dermatological research.
Cutometer MPA 580 — Skin Elasticity
A small probe applies gentle suction to the cheek, drawing the skin upward. Sensors measure how strongly the skin resists deformation (firmness) and how quickly it returns to its original position (elasticity). The combined ratio — Uv/Ue — captures the skin's overall viscoelastic quality.
A higher Uv/Ue score indicates younger, firmer-behaving skin. The device is used worldwide as the gold standard for objective, non-invasive skin firmness measurement.
Profilometry — Fine Lines & Wrinkles
Silicone replicas were taken of the crow's feet area around each eye — one of the most visible and sensitive indicators of skin ageing. These replicas were analysed under controlled oblique lighting to measure the depth and frequency of fine lines and wrinkles using the Rz roughness parameter.
A lower Rz value means the skin surface is smoother, with shallower and fewer visible lines. This is a direct, objective measurement of visible ageing — not a self-reported impression.

How Quickly Do Results Appear?
The first assessment after baseline was at week 4 — just one month into the study. At this point, measurable, statistically significant improvements were already visible in both active groups. This is one of the most commercially important findings in the data.
1 sachet/day (Group A):
+9.31% skin elasticity | -2.82% reduction in fine lines
3 sachets/day (Group C):
+19.96% skin elasticity — more than double | -3.28% reduction in fine lines
Both results confirmed statistically significant. Placebo group: no meaningful change.
The week 4 gap between the two active doses is striking. Three sachets per day produced more than twice the elasticity gain of one sachet per day at the same time point — demonstrating a clear, immediate dose-response relationship. By week 4, Group C had already surpassed the 12-week result that Group A would eventually reach on the lower dose.
The p-values at week 4 are highly significant: 2.04 × 10⁻⁴ for Group A and 2.06 × 10⁻¹⁰ for Group C — both many orders of magnitude below the 0.05 threshold for statistical significance. These are not borderline results.

Progressive Improvement Over 16 Weeks
Skin Elasticity — Cutometer Results
Both active groups showed continuous, compounding improvement in skin elasticity at every single time point throughout the study. The improvements were not a one-time spike — they built progressively with each successive assessment.
| Baseline | Week 4 | Week 8 | Week 12 | Week 16 | |
|---|---|---|---|---|---|
| Group A (1 sachet/day) | 0.557 | 0.609 (+9.3%) |
0.653 (+17.3%) |
0.711 (+27.7%) |
0.752 (+35.0%) |
| Group B (Placebo) | 0.558 | 0.560 (+0.3%) |
0.559 (0.0%) |
0.559 (0.0%) |
0.559 (0.0%) |
| Group C (3 sachets/day) | 0.552 | 0.662 (+20.0%) |
0.773 (+40.0%) |
0.888 (+60.9%) |
0.892 (+61.5%) |
Uv/Ue ratio — higher score indicates firmer, more elastic skin. % change calculated vs individual group baseline. p-values for both active groups: < 0.05 at all time points.
A particularly important detail from the Group C trajectory is the rate of gain between time points. From week 0 to week 4, week 4 to week 8, and week 8 to week 12, Group C gained approximately 20% of baseline elasticity in each four-week period — a remarkably consistent rate of improvement. Only between weeks 12 and 16 did the rate slow materially (+0.7%), indicating the skin was approaching a natural ceiling for this dose at this duration.
Group A's trajectory tells a different story: improvement continued to accelerate through to week 16, with no sign of plateau. At the standard dose, there may be further gains available beyond the 16-week study window.

Fine Lines & Wrinkles — Profilometry Results
The profilometry data confirms the elasticity findings from a completely different angle — measuring the visible surface of the skin rather than its mechanical properties. Both measurements point in the same direction.
| Baseline | Week 4 | Week 8 | Week 12 | Week 16 | |
|---|---|---|---|---|---|
| Group A (1 sachet/day) | 114.0 | 110.8 (-2.8%) |
108.9 (-4.5%) |
106.7 (-6.4%) |
105.4 (-7.5%) |
| Group B (Placebo) | 112.4 | 112.2 (-0.1%) |
113.0 (+0.5%) |
111.9 (-0.4%) |
112.6 (-0.2%) |
| Group C (3 sachets/day) | 113.2 | 109.5 (-3.3%) |
103.5 (-8.6%) |
98.6 (-12.9%) |
97.9 (-13.6%) |
Rz values (parallel direction, crow's feet area). Lower score = smoother skin surface, shallower and fewer visible fine lines. % figures show reduction from baseline — a reduction is an improvement.
The profilometry results are statistically significant at every time point for both active groups — with p-values reaching as low as 1.70 × 10⁻¹¹ for Group A at week 16 and 6.18 × 10⁻¹⁴ for Group C at week 16. These are exceptionally robust findings. By contrast, the placebo group fluctuated within a fraction of a percent of baseline throughout, with no consistent direction of change and no statistical significance at any point.

Every Single Active Participant Improved
The mean results are compelling, but the individual subject data from Appendix 7 is arguably even more persuasive. Looking at the raw data for each participant:
Group A (1 sachet/day):
every participant improved | range: +23.2% to +53.0%
Group C (3 sachets/day):
every participant improved | range: +50.0% to +75.6%
Not a single active participant failed to respond. Even the lowest individual improvement in Group C (+50.0%) exceeds the mean for Group A.
This universality of response is unusual in clinical consumer research and strengthens confidence in the findings considerably. It means the mean improvements are not inflated by a small number of high responders — the improvements were broadly distributed across all participants.
The standard deviation of Cutometer readings in Group A remained tight and actually narrowed by week 16 (±0.026 at baseline vs ±0.029 at week 16), confirming that the improvements were consistent rather than highly variable between individuals.

Results That Hold — The Week 12 to Week 16 Story
Group C's results between weeks 12 and 16 deserve particular attention. By week 12, the 3-sachet group had achieved a +60.9% improvement in skin elasticity — a remarkable result by any measure. In the final four weeks of the study, rather than declining, that improvement held and slightly extended to +61.5%.
This is not a product that produces temporary, short-lived changes. The fact that Group C's results were essentially maintained from week 12 through week 16 — even as the rate of new improvement slowed — suggests that the skin's structural changes are durable with continued use.
For Group A, the picture is different in an encouraging way: improvement was still actively growing between weeks 12 and 16, up from +27.7% to +35.0%. At the standard dose, the skin was still responding after four months. There is no evidence of a plateau at this dosage level within the study timeframe.

Statistical Significance — What the Numbers Mean
Every result reported above for the active groups clears the bar for statistical significance (p < 0.05) by an enormous margin. To put the p-values in context:
| Measurement | Week 4 | Week 8 | Week 12 | Week 16 |
|---|---|---|---|---|
| Group A — Elasticity | 2.04 × 10⁻⁴ | 3.91 × 10⁻⁷ | 4.14 × 10⁻⁹ | 3.96 × 10⁻¹¹ |
| Group C — Elasticity | 2.06 × 10⁻¹⁰ | 5.35 × 10⁻¹³ | 3.59 × 10⁻¹⁴ | 1.52 × 10⁻¹⁴ |
| Group A — Fine Lines | 5.15 × 10⁻⁹ | 7.70 × 10⁻¹⁰ | 2.62 × 10⁻¹⁰ | 1.70 × 10⁻¹¹ |
| Group C — Fine Lines | 1.17 × 10⁻⁹ | 3.06 × 10⁻¹² | 6.32 × 10⁻¹⁴ | 6.18 × 10⁻¹⁴ |
| Group B — Elasticity | 6.99 × 10⁻¹ | 8.89 × 10⁻¹ | 7.97 × 10⁻¹ | 8.76 × 10⁻¹ |
Significance threshold: p < 0.05. Group B (placebo) p-values are all close to 1.0 — confirming zero meaningful change. Active group p-values are between 10,000 and 100,000,000,000,000 times more significant than the threshold.
The consistently extreme p-values across both active groups, both measurement methods, and all five time points are not typical in consumer product clinical trials. They reflect a genuine, powerful biological response — not a marginal or borderline effect.
The ABUCLI1 trial provides robust, independently verified, double-blind clinical evidence that Altrient C improves skin firmness, elasticity and the visible appearance of fine lines and wrinkles — at both standard and high doses.
The key conclusions are:
- Measurable results begin within 4 weeks at both dose levels
- 3 sachets/day produces more than double the elasticity gain of 1 sachet/day at every time point
- 1 sachet/day: +35% elasticity and -7.5% fine lines after 16 weeks
- 3 sachets/day: +61% elasticity and -13.6% fine lines after 16 weeks
- Every single active participant improved — 100% response rate across both groups
Improvements continued to build throughout the study with no signs of reversal. The placebo group showed zero meaningful change at any point, confirming the active ingredient drives the results. All findings are statistically significant with p-values far exceeding standard scientific thresholds
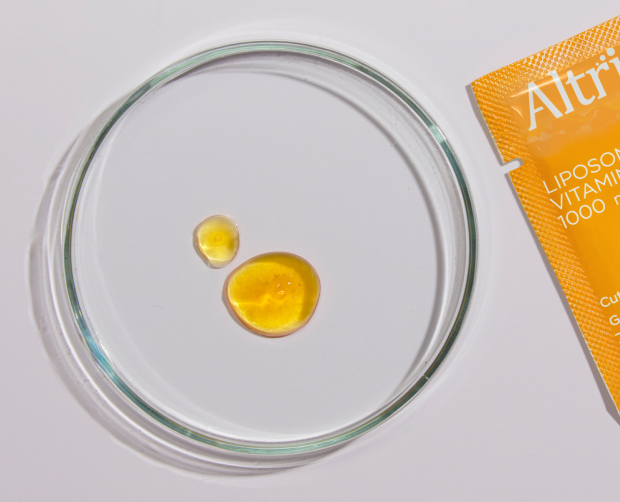
Featured in this study:
✓ 1000mg sodium ascorbate—a gentle form of vitamin C
✓ 500mg phosphatidylcholine for cellular health
✓ Just 5 ingredients
✓ Unflavoured, unsweetened
✓ Single sachets for optimised liposome stability
✓ Multi-award winning formula
✓ Triple-tested for potency + purity
Altrient C is naturally free from sugars, sweeteners, colours, flavours, glycerine, gluten, nuts, GMO ingredients, yeast, hexane, soy protein, dairy and other animal byproducts. It is 100% vegan-friendly.